
The above title is in reference to the recent fall in crude oil prices and its effect on downstream derivative products like PTA (purified terephthalic acid) and MEG (mono-ethylene glycol). PTA and MEG, in the ratios of 0.84:0.33, are added to get 1 unit of polyester fibre. Indo Rama Synthetics Ltd (IRSL) is one of India`s largest producers of polyester fibre and currently trades for a market cap of Rs 676 Crs or Rs 43/share. This article has been written with a single overarching assumption: that crude prices will remain at $ 50-60 per barrel in the foreseeable future and that an investment in IRSL will be similar to buying a put option on crude oil. As crude prices remain low, IRSL, whose main raw material inputs are PTA and MEG, is going to hugely benefit.
WHY WILL CRUDE OIL PRICES STAY LOW
To answer this, I borrow heavily from Financial Times and Citibank. Citibank was one of the very first investment banks to predict that US oil production would double by 2020 and this was articulated in a report titled ‘Energy 2020 – North America, the New Middle East?’. I remember in 2009 that Peak Oil was the most commonly referred to term in the energy industry. Peak Oil refers to the phenomenon where more than 50% of the Earth`s oil reserves have been used up. By 2013, shale gas, horizontal drilling and fracking were the most common terms. Citibank`s commodities chief recently criticized industry analysts for relying too heavily on the Peak Oil phenomenon for their predictions. A Saudi Foreign minister famously said ‘The Stone Age did not end for the want of stones’ implying that the age of oil will not end for the want of oil. A 7 June 2015 article by Nick Butler in FT.com titled ‘Oil Prices – the next move is downwards’ points out that even the $ 65 per barrel price seen at the time of the article`s publication is unviable given that OPEC`s (organization of petroleum exporting countries) actual production was higher by 1.4 million barrels per day than the organization`s official target. In spite of the higher production, OPEC has been unable to drive US shale gas producers out of business. This shows that the oil industry, capitalism`s most famous oligopoly, is set to see more competition and the waning influence of the OPEC cartel.
ABOUT INDO RAMA
IRSL was setup in 1989 to manufacture polyester, a versatile fibre which is used in everything from toothbrush bristles to clothing. The company`s plant was setup in Butibori, Nagpur in the state of Maharashtra and subsequent capacity additions were carried out in the same location. The company has built 84 MW of captive power generation capacity comprising of 40 MW coal and 44 MW diesel fired plants. IRSL has also incorporated a subsidiary, Indo Rama Renewables Ltd (IRRL), a green power company which has setup a 30 MW wind power plant. By 1994, IRSL had a 300,000 tons per annum polyester plant in Nagpur and by 2006, the same was expanded to 600,000 tons per annum. The 2006 expansion, which was done using Zimmer AG Germany`s technology, cost the company Rs 1000 Crs. Currently, the company has an installed capacity of 701,300 tons per annum of polyester.
PRODUCT WISE PRODUCTION BREAKUP
IRSL`s polyester production is divided into 4 product lines: Polyester Filament Yarn (PFY), Polyester Staple Fibre (PSF), Draw Texturized Yarn (DTY) and Textile Chips. PFY constitutes 37%, PSF is 37.5%, DTY is 13% and Textile chips constitute 12.5% of the total production. Attached below is a chart showing the capacity utilization of individual product lines over the years.

Capacity utilization has been dropping over time with the textile chips category being the worst hit. The reasons for this include the unavailability of the main raw material PTA in 2012-14 and a general economic slowdown.
For 2013-14, the company`s annual report mentions that an unscheduled breakdown of Indian Oil Corporation`s PTA plant resulted in a shortage of PTA in India and the same affected operating rates by 65-70%.
PRODUCT WISE REALIZATION
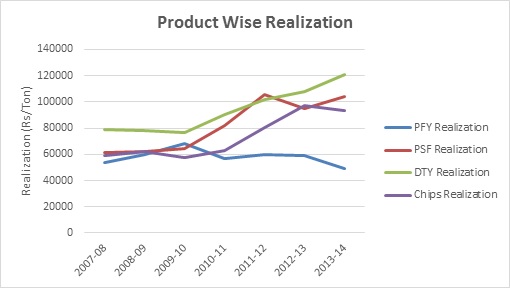
Product wise realization has been steadily increasing over all product lines except for polyester filament yarn.
FINANCIALS
Over the past 7 years, company`s average gross revenue is close to Rs 2883 Crs. Profit before depreciation, interest and taxes (PBDIT) has averaged 9% and raw material cost as a % of revenue has averaged 75%. For the year ended 2014-15, the company had secured loans of Rs 240 Crs and unsecured loans of Rs 204 Crs.

Secured and unsecured loans have been on a downtrend and the debt service coverage ratio (DSCR) has improved substantially in the past year. (DSCR has been calculated by including loan repayment).
Forex fluctuation has had an adverse impact on the company`s financials for the years 2011-12, 2012-13 and 2013-14. For 2011-12, the company took a Rs 65 Crs hit due to forex. For 2012-13 and 2013-14, the fluctuation hit was Rs 40 Crs and Rs 100 Crs respectively. For 2013-14, the company`s cost of goods sold amounted to Rs 2125 Crs of which Rs 1625 Crs of raw material were imported. The company is a large importer of PTA and MEG and the depreciation of the rupee from 2011-14 has affected it negatively and hence the forex losses.
Interest payment over the past 8 years has averaged at Rs 67 Crs. In 2007-08, the company paid Rs 91 Crs of interest while the interest payment for the current year stood at Rs 44 Crs.

While free cash flow to firm has been volatile over the past 7 years, the spending on capital expenditure has been more or less constant showing that the same was done as maintenance capex. The company`s net block in 2007-08 was Rs 1765 Crs while currently it is Rs 1140 Crs. Capacity addition since 2007-08 has been minimal.
The company`s working capital position has been frugal given the fact that the days of payable have been substantially higher than the days of inventory and receivable. This has led to a negative cash conversion cycle implying that the company`s cash inflow happens well in advance to the time when the company actually sells its products. Net Working Capital has been negative for 4 years out of the last 8 years. It also indicates that the company`s solvency position is precarious and that the company`s suppliers may see their working capital positions stretched due to this.
RAW MATERIAL COST
As mentioned earlier, the company`s main input raw materials are PTA and MEG. Both these products are crude oil derivatives and their prices are well correlated with the price of crude oil.

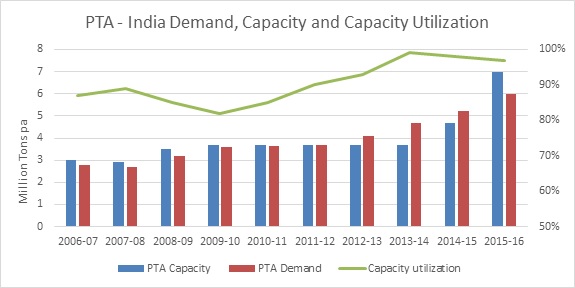
Source: Mitsubishi Chemical Corporation (MCC) PTA India

Source: Mitsubishi Chemical Corporation (MCC) PTA India
Above chart shows the global demand and supply position of PTA. PTA capacity utilization has dropped from the high 90`s, seen in 2006-07, to 73% currently. The situation is expected to remain unchanged until at least 2017.
For mono ethylene glycol (MEG), reliable historical data has been hard to find but market commentary shows that MEG prices are expected to remain stable for some time to come. MEG does not suffer the same type of over-supply situation as that of PTA. It needs to be noted that MEG constitutes only 30-35% of IRSL`s raw material cost and that the largest chunk of raw material cost is attributed to PTA since 0.86 PTA + 0.33 MEG are combined to get 1 unit of polyester.
The Indian PTA situation is tighter and shows from the higher operating rates achieved by Indian PTA manufacturers. Irrespective, PTA prices are still expected to drop since India`s PTA production capacity is less than 10% of total world capacity, which stands at 84 million tons pa. Of the 84 million tons pa, 84% of production comes from Asia. So, Asian PTA production capacity of 70 tons pa is far bigger than India`s 7 million tons pa capacity.
ANTI DUMPING DUTY AND SUBSEQUENT CANCELLATION
India imposed an anti-dumping duty on PTA imports in July 2014. The duty imposed an additional cost of $ 19 – $ 117 per ton of PTA imported from different countries. The duty was a boon to Indian PTA manufacturers but adversely affected Indian PTA end users. The duty was cancelled in April 2015 and PTA imports have begun to rise again.
INDIA POLYESTER DEMAND
India`s polyester demand has been very volatile for the past 10 years as shown in the below graph. The IRSL recommendation has not been written keeping in mind India`s future polyester growth. While Indian polyester growth maybe robust in the future, the volatility dissuades me from making any concrete projections about future polyester demand growth. Tecnon OrbiChem, a well-known petrochemicals data provider, expects world polyester capacity utilization to hover around 65% (for both PSF and PFY) for 2015-16. With India macro growth expected to be better, we can assume marginally better utilization rates for polyester manufacturers in India.
INDIA AND INDO RAMA POLYESTER PRODUCTION
As per Indo Rama`s 2013-14 Annual Report, Indian Fibre demand is estimated at 8.4 million tons of which cotton constituted 4.8 million tons and polyester fibre (PSF and PFY) demand was 3.2 million tons. Polyester and Cotton make up 94% of total fibre demand in India. IRSL`s 700,000 tons polyester fibre capacity makes up 15-20% of India`s total polyester demand making IRSL a significant player in the Indian polyester space. Under the polyester category, polyester filament yarn (PFY) demand stood at 2.4 million tons and polyester staple fibre (PSF) demand was 0.73 million tons.
PROBLEMS WITH LOAN REPAYMENT
The last 7 years have been a horrible period for IRSL. Every year, the company has had to re-schedule its loan repayments and re-negotiate with borrowers. While the company has not defaulted and has managed to pay off its loans, it has been a struggle nonetheless. The company had also resorted to using short term funds for long term purposes.
| 2007-08 | 2008-09 | 2009-10 | 2010-11 | 2011-12 | 2012-13 | 2013-14 | |
| Delay in repayment of dues to banks and debenture holders (Rs Crs) | 117 | 235 | 84 | 167 | 135 | 45 | 281 |
| Use of Short term funds for Long term purpose (Rs Crs) | 67 | 340 | 136 | – | 307 | 238 | 160 |
In some instances, the company has also delayed the payment of taxes to governments and has paid them late with a penalty. Also, in the last 2-3 years, the company`s delays have only been within the same financial year and none of the delays have been carried forward to the next year.
CREDIT DOWNGRADE AND SUBSEQUENT UPGRADE
In November 2013, ICRA downgraded IRSL`s short term and long term debt facilities to ‘D’, thanks to forex losses, company`s letter of credit being overdue for more than 3 months, adverse polyester business cycle and constrained raw material supply. By July 2014, the ratings were upgraded to BB-/A4, reflecting the company`s substantially improved financial scenario.
MARK TO MARKET LOSSES AND TAX ADJUSTMENT LIABILITY FOR 2007-08
For year ended 2008, the company had failed to include mark to market losses worth Rs 12 Crs on outstanding derivative instruments. Also, minimum alternative tax (MAT) liability worth Rs 15 Crs for the period 2001-07 was adjusted from General Reserve instead of from the P&L account. For 2007-08, the company had made a meagre PAT of Rs 4 Crs. Had these 2 adjustments been made as per Accounting Standards, the company would have made a loss of Rs 20 Crs.
FOREX ACCOUNTING VARIANCE FOR 2007-08
The company had made an accounting change on foreign exchange borrowings towards acquisition of fixed assets. Had this change not been made, the company`s PAT would have decreased by Rs 24 Crs.
COMPOSITION OF BOARD OF DIRECTORS
For 2013-14, the company`s board of directors constituted of 9 members of which only 4 were independent directors. Hence, this is a violation of Clause 49 of the Listing Agreement which requires that a company have at least 50% of board members to be independent.
PROMOTER PROFILE
IRSL`s promoters come from the Lohia family who own Indo Rama Ventures in Thailand. Forbes calls Indo Rama Ventures as the world`s largest producer of Polyester, with 57 factories across 21 countries. The Lohia family owns a 67% stake in IRSL and has 3 family members as its board of directors: Mohan Lal Lohia, Om Prakash Lohia and Vishal Lohia. For 2013-14, Om Prakash Lohia and Vishal Lohia combined took home Rs 4.45 Crs.
http://www.forbes.com/global/2009/1116/outfront-thailand-aloke-lohia-polyester-profits.html
MAVI INVESTMENTS
Mavi Investments, the front end investment company of the controversial stock broker, Nirmal Kotecha, holds an 8.3% stake in Indo Rama Synthetics. It is alleged that Nirmal Kotecha idolized Harshad Mehta and that most of his wealth was made by manipulating small cap stocks like Usher Agro, Pyramid Saimira etc. In the case of Pyramid Saimira, media reports talk about how Nirmal Kotecha used a forged letter from SEBI which asked promoters to make an open offer to drive up the stock price. Indo Rama`s annual reports show that foreign institutional investor (FII) shareholding has remained steady at 8-9% for the past 8 years. The name, Mavi Investments, only figures recently in the company`s annual reports. Mavi Investments currently holds 1% stake in Amtek India, 1.2% in Cineline, 4.67% in DCW, 1.81% in Donear, 2.6% in Godfrey Philipps, 3.6% in Hindustan Dorr-Oliver, 1.8% in JSW Steel, 2.7% in JVL Agro, 2.3% in Monnet Ispat etc. A 2008 Outlook Business article which talks about the portfolios of famous investors has an interview of Nirmal Kotecha in which he mentions that his funds pick small and mid-cap companies trading at decent valuations. Even if Mavi Investments is a shady operation, it is impossible to assume that Indo Rama`s promoters are hand in glove with Nirmal Kotecha. Till date, SEBI has only imposed a fine of Rs 4 Lakhs on Mavi Investments for failing to disclose its stake in SEL manufacturing.
http://alphaideas.in/2014/08/13/portfolio-mavi-investment-fund-ltd/
http://www.moneycontrol.com/news/cnbc-tv18-comments/revealed-nirmal-kotechas-identity_394933.html
PROMOTERS BUY OUT JAPANESE TRADING FIRM
In January 2014, Indo Rama`s promoters increased their shareholding in IRSL from 64 to 67% by buying out the IRSL shares held by a Japanese trading firm, Itochu Corp.
LIQUIDATION VALUE
For a market capitalization of Rs 676 Crs and total debt of Rs 446 Crs, the company`s enterprise valuation is Rs 1122 Crs. The company`s 300,000 ton expansion in 2006 cost Rs 1000 Crs. The company`s current Net Block stands at Rs 1140 Crs. The company owns and operates 30 MW of wind power plants, which was commissioned in 2012. Wind Plants cost Rs 5 Crs/MW, bringing the value of those plants to Rs 150 Crs. Add to this the other 400,000 tons of capacity and 84 MW of coal and diesel fired generating stations, the company`s current enterprise valuation is equal to or below its liquidation value.
PTA EXPANSION
In Annual Report 2012-13, the company mentions the signing of an MoU (memorandum of understanding) with Indonesia`s Indo Rama Ventures to setup a PTA plant in Tamil Nadu. The plant, which was expected to cost Rs 5000 Crs, if setup, would allow Indo Rama to buy all its PTA requirement from this new facility. Annual Report 2013-14 has no mention of this MoU and has nothing about the PTA plant. The current PTA over supply situation suggests that such backward integration at this juncture, would be negative for the company and its shareholders.
COMPETITOR PROFILE – JBF INDUSTRIES
Reliance Industries is the world`s biggest producer of polyester with a capacity of 2.5 million tons per annum. But since RIL is a conglomerate, I thought it would be better to compare Indo Rama with JBF Industries, a similar competitor. For 2014-15, JBF`s consolidated P&L was as follows: Revenue of Rs 8900 Crs, EBIDTA margin of 10%, Rs 120 Crs forex fluctuation loss, PBT of Rs 90 Crs and PAT of Rs 31 Crs. The company paid interest worth Rs 423 Crs on total loans worth Rs 8232 Crs, which have increased from the previous year`s Rs 5951 Crs. JBF has the capacity to produce nearly 2 million tons per annum of polyester of which 950,000 tons are in India and the remaining distributed between UAE, Belgium and Bahrain. Also, 72% of the company`s production capacity is dedicated to producing polyester chips, 13% to polyester oriented yarn (POY) and 10% to films. Hence, from a product breakdown perspective, JBF is still very different from Indo Rama. Promoted by a technocrat entrepreneur, JBF trades for a market cap of Rs 2000 Crs and is the 2nd largest producer of textile grade chips and 3rd largest producer of bottle grade chips in India. JBF is currently setting up a 1.25 million MT pa PTA plant at Mangalore at a capex of $ 600 mn. In June 2014, JBF commissioned a $ 200 million facility in Belgium for manufacturing bottle grade chips and another $ 200 million facility in Bahrain for the same product. JBF`s chips and yarns have an average product realization between Rs 90,000 – Rs 110,000 per ton compared to the Rs 45,000 – Rs 65,000 per ton that Indo Rama`s products get. For the last 3 years, JBF`s average EBIDTA stood at Rs 705 Crs with an enterprise value of Rs 9800 Crs (Market Cap + Total Debt – Cash), giving JBF an EV/EBIDTA of 14x. Indo Rama`s 3 year average EBIDTA was Rs 221 Crs and current enterprise value stands at Rs 1122 Crs, giving Indo Rama an EV/EBIDTA of 5.0 x.
Aside from the comparison, I find JBF`s current and future expansion plans to be scary. JBF has taken on tremendous amounts of debt, parts of which are dollar denominated. With a slowdown looming in China and problems with Grexit, JBF`s expansion plans can go very awry.
Finally, the private equity firm, KKR, has just made an investment in JBF preferred shares. This investment was done with the intention of helping complete the company`s long standing Mangalore PTA project. Again, a preferred shares investment is senior to common shares and hence is a negative for normal shareholders.
CONCLUSION
Indo Rama has come out with excellent Q4 results for the year ended March 2015. Q4 EBIDTA stood at Rs 52 Crs. Average EBIDTA for the preceding 4 quarters was only Rs 17 Crs. More interestingly, the Q4`s Raw Material Cost as a % of Revenue stood at 74% while the same metric for preceding 4 quarters averaged 80%. For the financial year 2014-15, the company has reported a loss of Rs 20 Crs. The 4th quarter results are clear indications that Indo Rama`s performance is on an upswing thanks to favourable macroeconomics, raw material and stable government policy (with respect to PTA import).
DISCLOSURE: I hold lots of shares in Indo Rama Synthetic with the last bunch bought on 15 July. This website is a hobby for me and I do not charge my viewers anything. I am also not a research analyst since I do not get paid by my viewers. I just like to write about interesting companies whose valuations are trading at a rock bottom. I do not use material non-public information and have no hidden agenda in writing about these companies. So, I sincerely hope that SEBI does not categorize me as a research analyst and spares me from any legal hurdles.
